Beijing and Delhi often hit the news as two of the most polluted cities in the world, with PM2.5 levels often soaring to tens of times the WHO annual limit (10µg/m3). Smart Air plotted the PM2.5 data from the US Embassy in Delhi and the US Embassy in Beijing to compare how the air quality has been changing:
Beijing PM2.5 levels
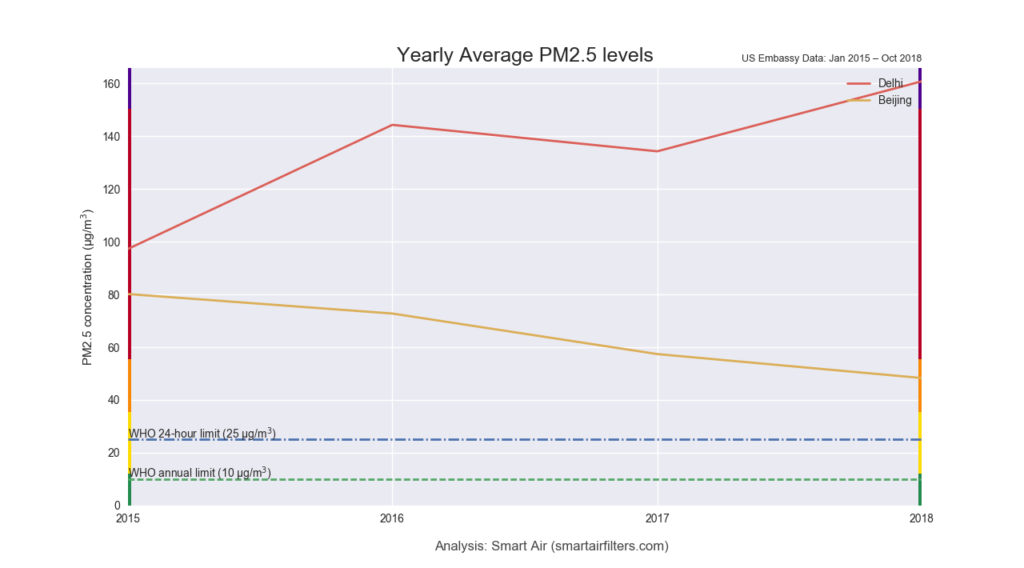
What’s amazing is that over the past 3 years Beijing’s air pollution levels have dropped by around 40% (from 80µg/m3 in 2015 to 48µg/m3 in 2018 YTD).
Delhi PM2.5 levels
On the other hand, Delhi’s pollution levels have continued to soar. In 2015 Delhi’s pollution levels were similar to those of Beijing (97µg/m3). However since then, PM2.5 pollution levels have increased 1.65 times to a record 161µg/m3 during the first 10 months of 2018. That’s more than 3 times more polluted than Beijing in 2018.
Why is Delhi so much more polluted than Beijing?
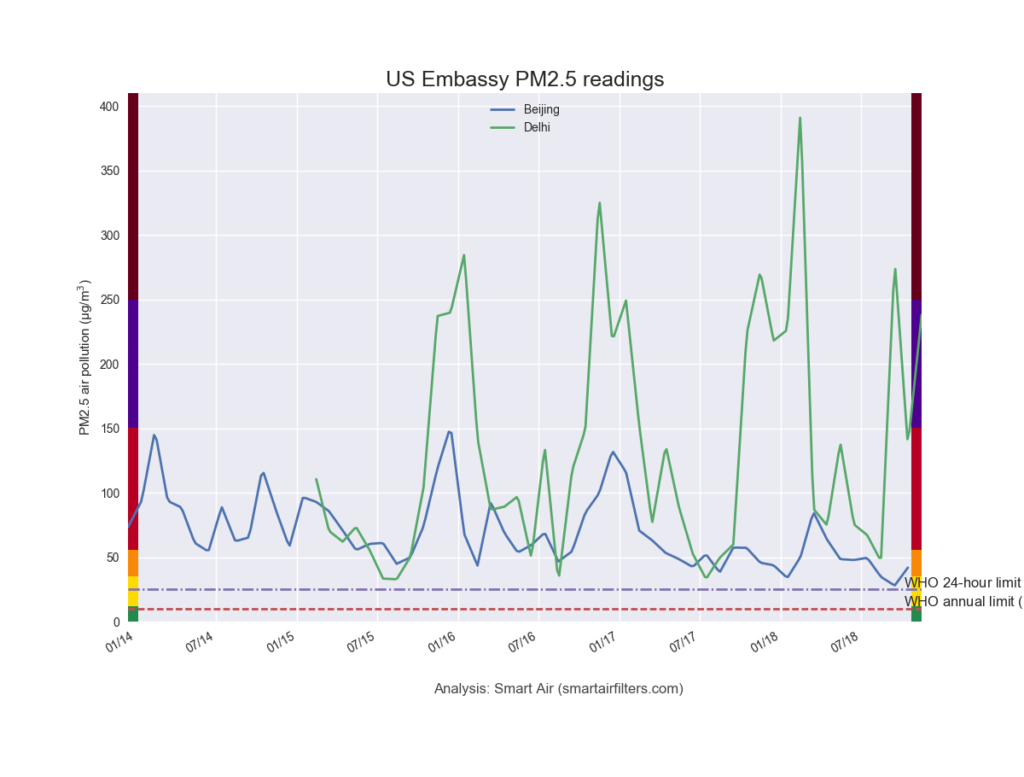
Check out this chart. It shows Beijing’s pollution levels by month over the past 4 years in blue (starting 2014) and Delhi’s over the past 3 years in green (starting 2015). We can see that during the summer months. Beijing and Delhi’s air pollution levels are roughly similar. Things change every winter, when Delhi’s PM2.5 levels shoot to an average of over 300µg/m3. That’s 30 times the WHO level! During these months, crop burning from the north of India and adverse weather conditions mean air pollution sits over Delhi increasing the PM2.5 levels.
Is Delhi or Beijing safer?
According to data from the WHO, neither city is safe. Both cities are far above the WHO annual limit of 10µg/m3. What’s more, the more studies I read, the more I’m convinced that there’s no safe level for PM2.5 air quality levels. For example, scientists used statistics to best estimate of how many people die each year from air pollution, at different levels of PM2.5 air pollution.

Take a look at the black line showing total worldwide deaths each year from air pollution. It goes up pretty fast. Even at 25 micrograms, it’s up pretty high. Now here’s where 2017—Beijing’s best year on record—falls on that graph.

This is what all that air pollution facts mean to me: air pollution is waging war on our bodies, even if we don’t have obvious symptoms, even if we’re young and healthy, and even if it’s at levels far below the ones that make the news. If you’re in virtually any city in China, or any city in India, you’re breathing air that is killing people and you need to protect yourself from this harmful air pollution.
What can I do about it?
Open data and transparency has shown that clean air doesn’t need to cost an arm and a leg. There are simple, no-nonsense solutions you can pick up today to protect yourself from air pollution. Find out more in our clean air store.
Free Guide to Breathing Safe
Want to learn more about breathing clean air? Join thousands more and stay up to date on protecting your health.