CADR tests are used to calculate how effective air purifiers are at cleaning air. People use CADR to compare the performance of different purifiers. However, performing a CADR test is not simple: it requires a particle monitor, a sealed 30m3 test lab, and tightly controlled testing conditions.

Because of the complexity of CADR tests, it would be really useful to have a simpler shortcut to calculate an air purifier’s CADR. One way people have tried doing that is to multiply an air purifier’s airflow by its filtration efficiency.
There have been a lot of great tests from researchers in Europe and the US comparing CADR numbers with airflow x efficiency numbers for DIY air purifiers. The tweet above is just one example. A group of Spanish researchers suggested using a correction factor of about 10%. This approach is far simpler and easier to do than running a CADR test. On the surface, the logic seems solid. However, there are several factors that this formula does not take into account. And those factors can introduce error into these estimates that make them different from CADR values calculated using one of the CADR standards.
Can Airflow Values be Converted to CADR Values?
CADR Values?In short: no. Long answer: You can calculate an estimated CADR for a given machine using this method. This can be useful for “quick and dirty” comparisons, but it can produce discrepancies with numbers from actual CADR tests.
4 Factors That CADR Tests Account for But Airflow Does Not
- Air mixing in a real room: In an ideal world, dirty air would pass through an air purifier, get cleaned, and then wouldn’t pass through the purifier again. However, the world is not so ideal. The clean air from the purifier mixes with dirty air in the room (like stirring sugar into our morning coffee), and then it passes through the purifier again. That means some of the air that was already cleaned passes through the purifier a second or third time. Re-purifying already purified air is not optimal, but it is inevitable. And that leads to a CADR that’s lower than just airflow x efficiency.
- The filtration efficiency of filters varies with air speed: It’s easy to think of a filter has having a single filter grade. This one is 99.9%. That one is 99.5%. But reality is actually a bit weirder than that. Filters are often slightly better when the air speed is low and slightly worse when the air speed is high. When you see a manufacturer’s filter efficiency, that number usually comes from a test at an air speed of 0.53cm/s, which is slow. Purifiers typically have airspeeds of 2 or 3m/s through HEPA filters. In these cases, the filter’s filtration efficiency can drop enough to mess up that simple formula.
How Much Lower Is CADR Than Airflow?
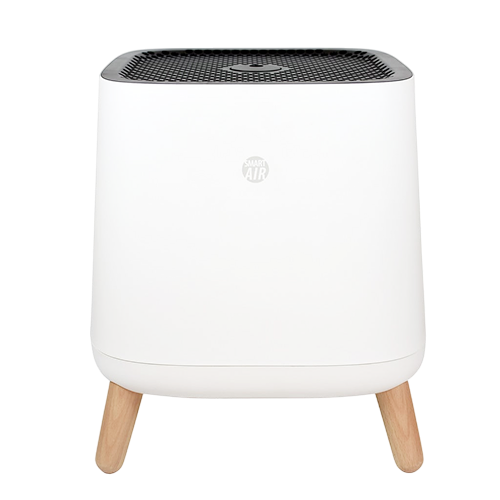
At Smart Air, we use airflow and CADR tests when testing purifiers like the Blast. We use both because each has its own advantages. Airflow tests give a quick and rough estimate of a purifier’s effectiveness; CADR is more precise. Because we do both types of tests, we can see how CADR and airflow values are on average for a range of purifiers.
To compare CADR and airflow, we analyzed test data from four Smart Air purifier models. We found no consistent conversion ratio between airflow (air volume) and CADR (clean air delivery rate). Here’s what we found:
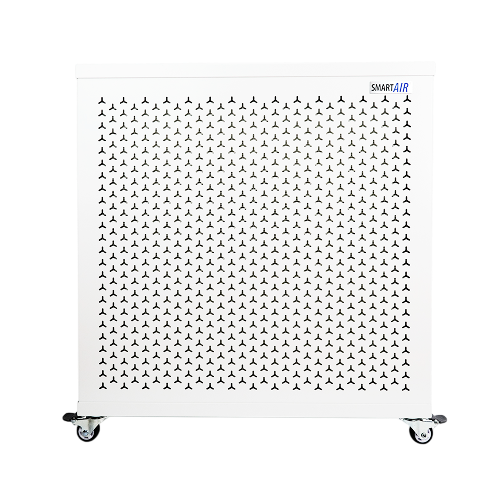
- For the Blast and Blast Mini, CADR is about 3% lower than airflow.
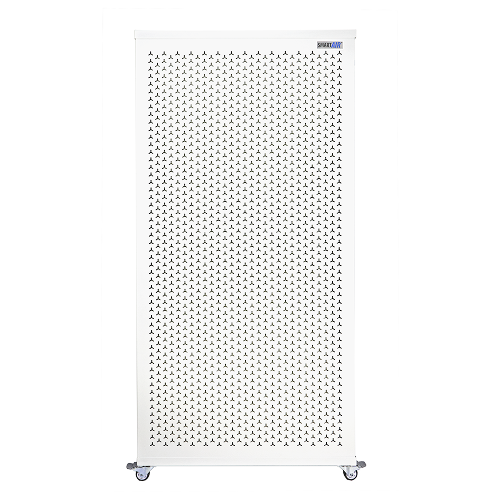
- For the SA600, CADR is about 10% higher than airflow.
- For the Sqair, CADR is about 6% lower than airflow.

With a very efficient filter (close to 100% efficiency), the CADR should, in theory, be the same as the airflow. But there are two ways CADR can differ from airflow:
1. CADR could be lower: If the air purifier isn’t very good at distributing air throughout the room, the CADR could be lower than airflow. For example, if the clean air coming out of the purifier gets sucked back in and filtered again and again, the CADR would be lower than the airflow.
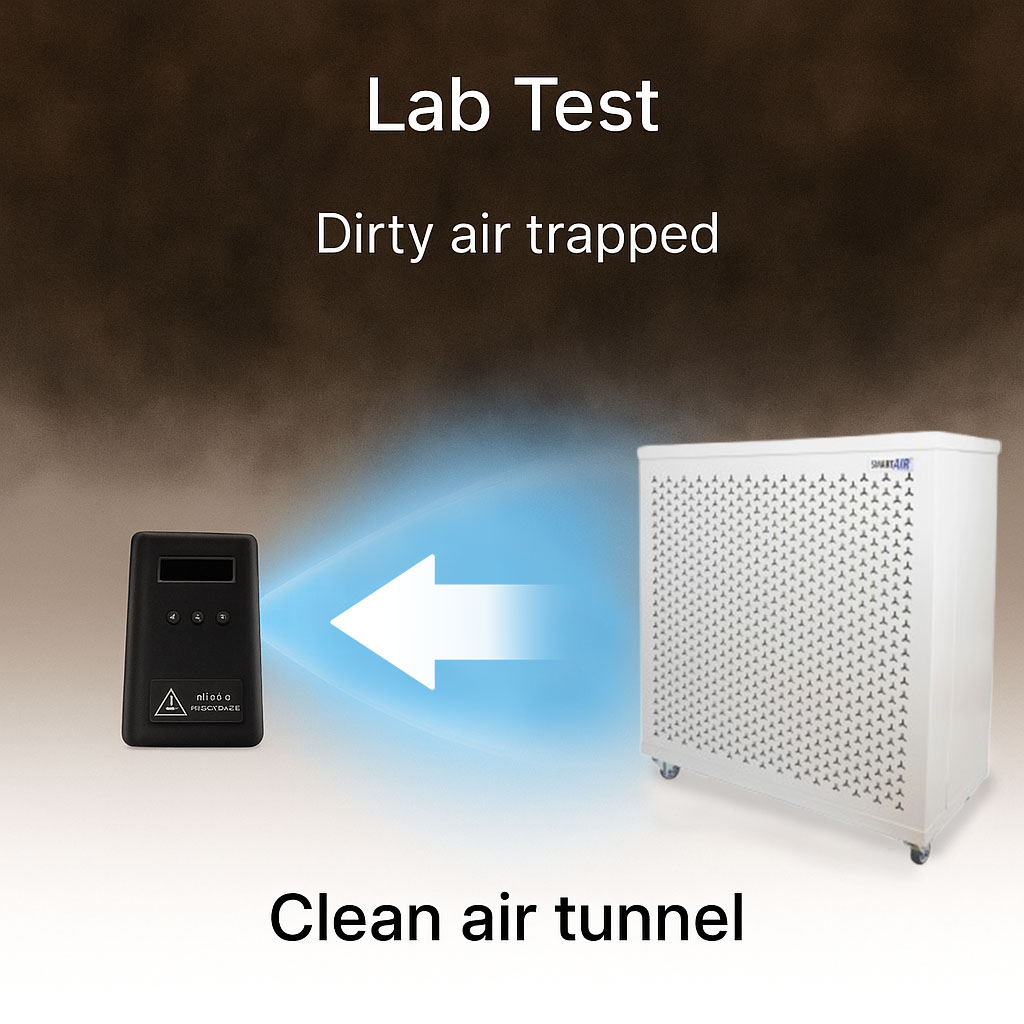
2. CADR could be higher: This scenario is often harder for people to understand, but it can happen if the clean air from the purifier is going directly to the air quality monitor, without cleaning the entire room. You can imagine an extreme case of this, where there’s a “tunnel” of clean air between the purifier and the air quality monitor. Meanwhile, all the rest of the dirty air in the room is just sitting there, stagnant. This could cause the CADR estimate to be higher than the airflow.
In practice, if CADR data is unavailable, you can use airflow as a “second best” metric of purifier performance. However, keep in mind that CADR estimated from standardized laboratory testing is the more precise benchmark.
Read More: Steps to Test an Air Purifier’s CADR
DIY Air Purifier Tests
Read More: How we test out air purifiers at Smart Air
Free Guide to Breathing Safe
Want to learn more about breathing clean air? Join thousands more and stay up to date on protecting your health.