This article accompanies our article on the reliability of KN95 masks being produced in China during the COVID-19 pandemic. It covers our testing method and provides the original data.
China N95 Masks – Test Method
During our mask tests, we followed as closely as possible the testing method used to certify N95 and KN95 masks. That’s the NIOSH-42C FR84 test standard (US) and the GB2626-2006 (China). These are also similar to the European standard (EN 149:2001) although there are a few differences.

In our test setup, a fan on the left end blows air and particles through the mask sample on the right our wind tunnel test section.

On the other end of the tube, we attached our mask sample, and adjusted the fan speed to achieve an airflow of 85L/min – measured using an anemometer.

Measuring Mask Particle Capture Effectiveness Using Met One
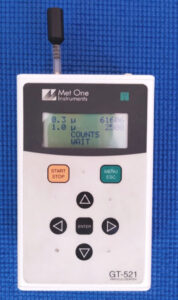
After setting up the material and the airflow, we then proceeded to use our Met One GT521 laser particle counter to measure the number of particles the materials could capture.
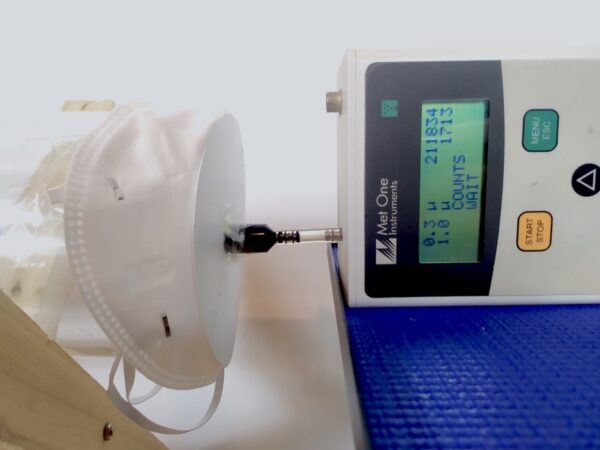
Met One is the company that makes the big BAM monitors that most governments use to measure air pollution, so we’re in good hands here.
It’s also worth noting that before starting our tests, we cross-referenced our Met One readings with two other monitors. This way, we could check the equipment for any calibration errors. In total, we cross-validated the readings of 3 Met One machines.
Comparing Particle Count With and Without N95 Mask
First, we measured the particle count without the mask attached, and then with the mask. We continued to measure the number of particles passing through the mask until the particle count reached a stable value, or for 5 minutes — as per the NIOSH standards.
Out testing method had a few notable differences with the NIOSH-42C US testing method. We’ve listed them out here and highlighted the different results in blue.
| Smart Air tests | NIOSH-42C FR84 | EN 149:2001 | |
| Flow rate: | 85L/min | 85L/min | 95L/min |
| Number of samples tested | 2 (new, conditioned at room temperature for 24hrs) | 20 (new, conditioned at 85% humidity & 38ºC for 25hrs) | 9 (3 new, 3 used, 3 after temperature & strength tests) |
| Test aerosol source | Ambient air pollution | Sodium Chloride | Sodium Chloride |
| Test aerosol size | Wide range of sizes | 0.075 microns | 0.06 – 0.1 microns |
| Test aerosol concentration | 3-68µg/m3 | <200mg/m3 | 4-12mg/m3 |
| Measurement location | 1 location, testing with & without mask attached | 2 locations: Before and after mask | 2 locations: Before and after mask |
| Measurement Procedure | Laser Particle Counter | Forward-light-scattering Photometer | Sodium Flame Photometry |
The main differences are:
- The type of pollutant (aerosol) used.
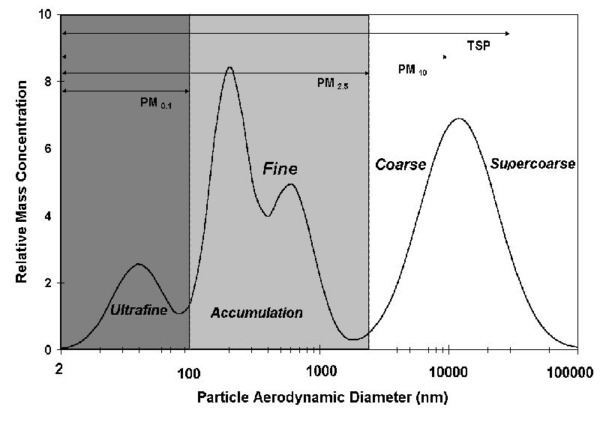
In the NIOSH tests, they use sodium chloride (salt) particles with a particle size of 0.075 microns (±0.02 microns). In our tests we used ambient air pollution, which means that the size of the particles vary greatly. Here’s a typical breakdown of the particles in the air by size.
- The amount of pollutant (aerosol) used.
In our tests, we were using ambient air pollution, with a concentration ranging from 3-68 micrograms. This is much lower than what is typically used in the NIOSH tests, with a concentration up to 200mg/m3 or 200,000 micrograms.
To see how much of a difference this had on the results, we ran a series of control tests where we polluted our test lab over 1,000 micrograms. We then re-ran the tests for two of our masks. Here’s how they performed under a high pollution load.
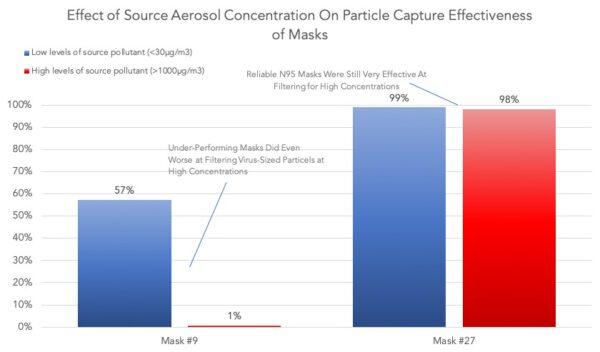
There was little impact for the masks that were performing well and meeting the N95 spec. The masks that didn’t meet the N95 spec at low levels of source pollution performed even worse at higher levels.
- Measurement procedure.
In the NIOSH tests, a forward-light-scattering photometer is used, whereas the measurement machine used by Smart Air was a Met One G521 Laser Particle counter. The biggest difference is with the particle size these machines can measure. The smallest particle size the Met One can measure is 0.3 microns, whereas the photometer is able to measure the tiny sodium chloride particles (0.075 microns). Despite these differences, our results are still valid and useful as data shows that 0.3 microns is often the most difficult particle size to capture.
Repeating the tests
We ran the whole series of tests 3 times for each mask, and made sure to test 2 samples of each mask type. This way, we could also account for variability in quality between masks.
N95 Mask Tests: Open Data
As part of Smart Air’s open-data policy, we are providing all the data in our experiments available for free for people to download and analyse. The data can be downloaded here:
N95 Mask Test Open Source Data – Smart Air
The data has been anonymized to remove the factory names. You can learn why we did this in our tips for sourcing N95 masks article.
Free Guide to Breathing Safe
Want to learn more about breathing clean air? Join thousands more and stay up to date on protecting your health.


Met One GT-521S Particle Counter
I know this can measure at 2.83L/min, so if the main stream is bigger than 3L/min, then how this device deal with the sample flow rate bigger than 2.83L/min?
Also, the NIOSH standard use particle size is average on 0.3 micron. (I think TSI 8130A cannot detect 0.075um.)