Take an average day in Delhi or Beijing. Not a bad day. Just a regular, old average day. The air coming into our lungs on those average days is 8 to 12 times the World Health Organization’s annual limit.

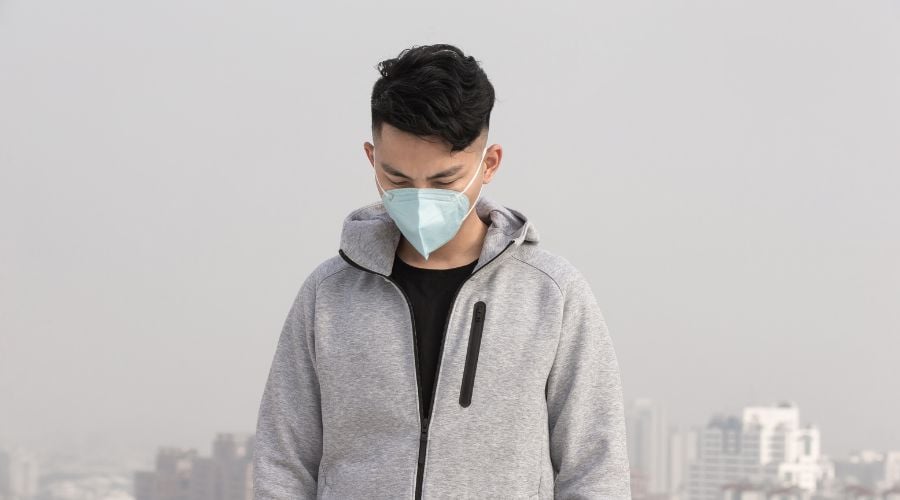
That’s bad! But a lot of people don’t start to get worried until it looks like this outside.

That’s not just my anecdotal experience. I can see those spikes in interest when I analyze internet searches for “purifier” against PM2.5 levels:

And all of this makes sense. We’re more scared when the air outside is really bad. But there’s a problem. Purifiers—and I mean all purifiers—perform worse at the exact times the most people are rushing to use them.
Now that’s a big claim. ALL purifiers? I’m a scientist for a living, so I’m wary of words like “all” and “always.”
But since I got interested in building DIY purifiers to protect my lungs from Beijing’s air, I’ve tested lots of different types of purifiers. My favorite test is what I call a “room test.” It’s exactly like how most people use purifiers—in a regular bedroom, with naturally occurring pollution, and no special seal around the doors or windows.

In those tests, I calculate what percentage reduction the purifier made in the amount of 0.5 micron particles in the room air. For example, on this day, the Original DIY purifier reduced particulate by 85%.

But while I’m doing these tests, the atmosphere is helping me run a little experiment. That’s because some days the outdoor air is 20 micrograms, and some days it’s 200 micrograms. And what I find with every machine I test is that percentage reductions are lower on days with bad air pollution. For example, here’s the percentage reductions achieved by the Blue Air 203 (y-axis) on days with different outdoor PM2.5 levels (x-axis):

On days with bad outdoor air pollution (on the right side of the graph), the Blue Air achieved lower percentage reductions. That’s despite the fact that the Blue Air was running on its highest setting (same for all tests below). Full details on the test method here.
It’s not just a Blue Air phenomenon. Here’s my test data for the Philips:

The same pattern is there for the humble DIY 1.1…

…as well as the “cleanest air guaranteed” IQ Air:

And the DIY Cannon:

Is there any way around this problem?
What’s an air breather to do? If you want to absolutely guarantee your indoor air will stay below the World Health Organization’s 25 microgram limit, there are two things you can do:
1. Seal up the doors and windows
Sealing up the doors and windows will make it harder for that outdoor pollution to get in, and it will make your purifier more effective. But if your home has chemicals coming from recent remodeling or new furniture, you might not want such a good seal! And even with a good seal, that won’t guarantee clean air.
2. Bring in back up
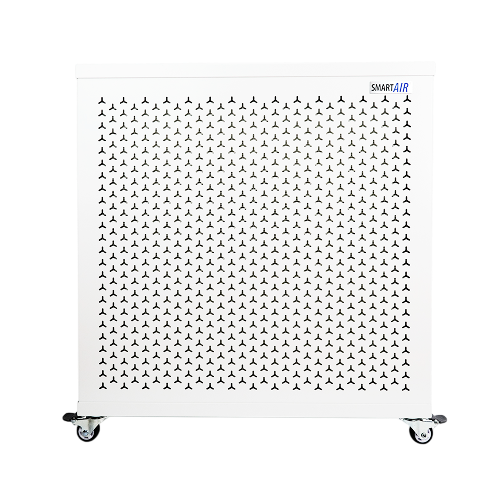
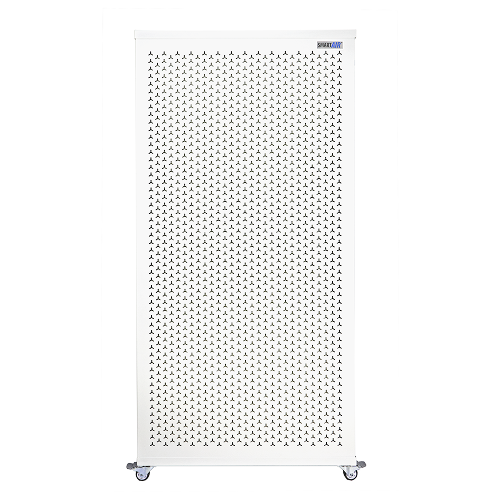
The only real way I can see to truly guarantee clean air in the worst airpocalypse is to overpower it. We can do that by using a second purifier (like Dr. Saint Cyr did in his Beijing apartment) or buying a machine that is rated for an even bigger room. For example, if you have a 15m2 bedroom and 30m2 living room, the Blast Mini should easily be able to overpower that because it’s rated for up to 85m2.
Open Data
As always, I’m posting the original test data and more details on the methods for fellow data nerds (and if anyone wants to replicate the tests).
Extra Data and Methods
All of the tests were done in a 15m2 bedroom in Beijing, Chaoyangmen. I’d rate the seal around the doors and windows as average for a Chinese apartment. I’ve seen better, and I’ve seen worse.
The graphs in the main article use the average outdoor PM2.5 micrograms during the overnight tests, as measured by the US Embassy in Beijing. This does not account for the times when PM2.5 goes up or down during the night, so most of the outlier datapoints are probably because the average PM2.5 masks the change overnight. The y-axis is the percent reductions in particles 0.5 microns and above, calculated from the start of the test, at the beginning of the night before the purifier was turned on, versus the average of the last four hours of the test (before waking up). The particle counter was a Dylos Pro.
More details on the test method are in my earlier comparison tests of the DIYs and the big brands. There are also more details in my earlier here and here.
Is the effect stronger for some machines?
If you look carefully at the graphs, you’ll notice that some machines saw some really nasty air and some didn’t. For example, the worst the DIY 1.1 saw was 322 micrograms. The worst the Philips saw was 108 micrograms.
That makes me hesitant to compare how big of a drop there is across the machines. I’d want a larger dataset before I’d be confident to interpret the average drop in effectiveness between machines. However, it would make sense that machines that put out a higher volume of air should see smaller drops in effectiveness on bad days.
Original Data
Cannon Data: The Cannon data comes from the original Cannon tests and from tests of the Cannon + pre-filter, which we found made almost no difference in effectiveness. The Cannon + pre-filter test data is available in the post about the Xiaomi auto-mode.
Philips and Blue Air Data: This data is in my directly comparable purifier tests.
IQ Air Data: The IQ Air data comes from my other direct comparison tests.
DIY 1.1 Data: The data for the DIY 1.1 is in the DIY 1.1 test post.


I don’t understand how to measure your air purification efficiency. In my understanding, when … 阅读更多 »
Professor, I would like to put in a request to please, please update product specs with this disclai… 阅读更多 »